Tungsten Clustering support true distributed multimaster MySQL / MariaDB / Percona Server clustering. In this topology, there are cross-site replicator services for each remote site. In a 3-site configuration, there are a total of 9 replication streams to manage.
Tungsten Clustering also offers a graphical administration tool called the Tungsten Dashboard™ to help with your management burden. The GUI makes the deployment much easier to visualize and administer.
For our example, we will have a Composite Multimaster dataservice called global with three active, writable member clusters (one per site), east, west and north.
Dashboard Summary View
In the summary, collapsed view, the composite service and all member clusters are listed with associated information and controls. Note that the Type for the composite dataservice global is CompMM (Composite MultiMaster), meaning all clusters contain a write master locally. (click to expand):
Dashboard Expanded Cluster View
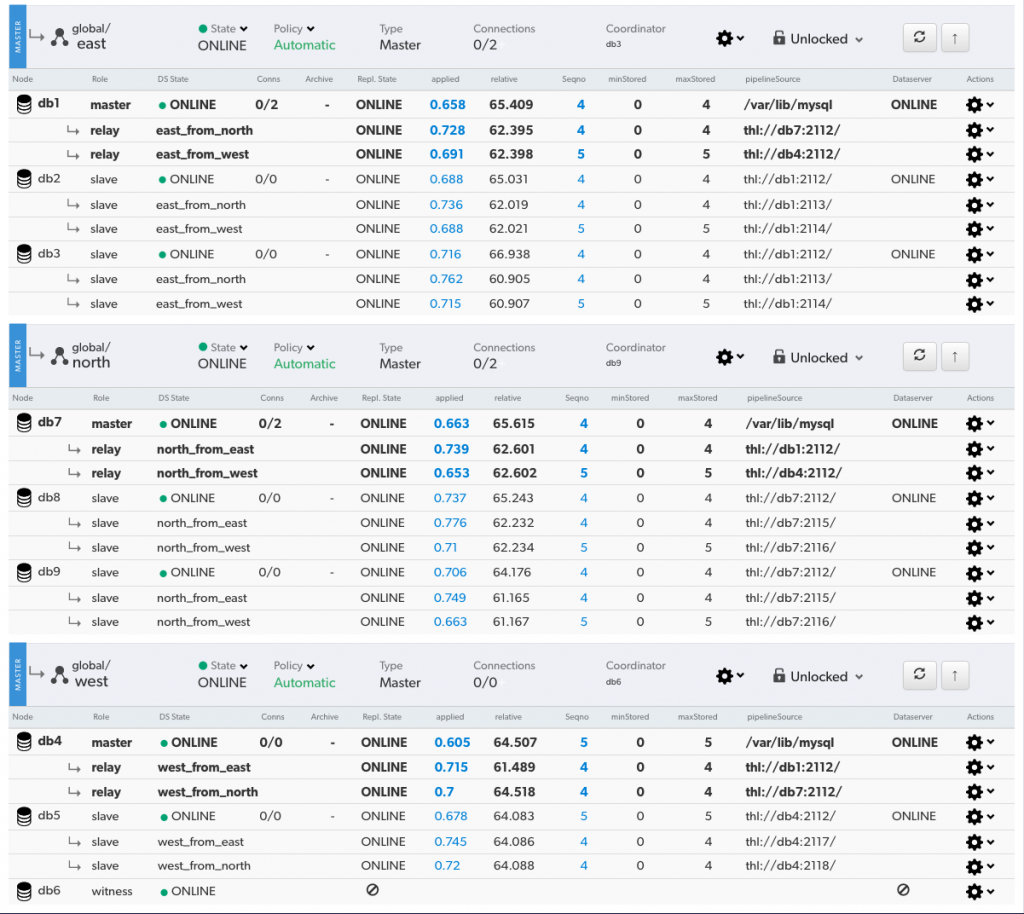
We can look at the full status of all layers of each cluster in one simple view (click to expand):
You can see that each site has two subservices per node, one per remote site. Each sub-service is responsible for pulling writes from the remote clusters and applying them to each node.
Cluster east has sub-services east_from_west and east_from_north.
Cluster west has sub-services west_from_east and west_from_north.
Cluster north has sub-services north_from_east and north_from_west.
Taking the Correct Path
The Multimaster Replication Relay Model
A relay model is employed so that there is one node (the current master) that acts as the THL relay from the related remote site. This reduces WAN bandwidth utilization dramatically.
For example, in service east, we show three nodes, each with three replication services, one for the local cluster dataservice, and one each per remote cluster.
Each line shows the service name, role and pipeline source (with source host and port highlighted):
db1 Replication Services
- east, master, /var/lib/mysql
- east_from_north, relay, thl://db7:2112/
- east_from_west, relay, thl://db4:2112/
db2 Replication Services
- east, slave, thl://db1:2112/
- east_from_north, slave, thl://db1:2113/
- east_from_west, slave, thl://db1:2114/
db3 Replication Services
- east, slave, thl://db1:2112/
- east_from_north, slave, thl://db1:2113/
- east_from_west, slave, thl://db1:2114/
The Nitty Gritty
"What does this all mean?"
The above shows up many important things about the east dataservice. Let's take a look at what is happening on each node and how they vary:
Node db1
- is the master of the local cluster
- acts as the relay from north, pulling data from remote node db7 on port 2112. Port 2112 on node db7 is the listener for the local cluster service north, the same one the local slaves talk to for THL.
- also acts as the relay from west, pulling data from remote node db4 on port 2112. Port 2112 on node db4 is the listener for the local cluster service west, the same one the local slaves talk to for THL.
Node db2
- is a local slave.
- acts as slave for service north, pulling data from local relay node db1 on port 2113. Port 2113 on node db1 is the listener for the relay service east_from_north.
- also acts as slave for service west, pulling data from local relay node db1 on port 2114. Port 2114 on node db1 is the listener for the relay service east_from_west.
Node db3
- is a local slave.
- acts as slave for service north, pulling data from local relay node db1 on port 2113. Port 2113 on node db1 is the listener for the relay service east_from_north.
- acts as slave for service west, pulling data from local relay node db1 on port 2114. Port 2114 on node db1 is the listener for the relay service east_from_west.
Better Vision and Control
"How does this help me?"
The Dashboard helps us visualize the current performance in terms of replication lag between clusters.
We can take individual replication services offline, for example when doing impactful schema changes.
The state of every layer is represented, and a failure is obvious. The tab bar updates every 30 seconds, even if auto-refresh is not enabled, meaning that you always aheva relatively recent status of the entire enterprise.
For more details, please visit the docs page at http://docs.continuent.com/tungsten-dashboard-1.0/index.html
In summary, use the Tungsten Dashboard to easily administer all your Tungsten clusters!
Tungsten Clustering is the most flexible, performant global database layer available today - use it underlying your SaaS offering as a strong base upon which to grow your worldwide business!
Click here for more online information on Tungsten Clustering solutions
Want to learn more or run a POC? Contact us.


Comments
Add new comment