Prometheus and Grafana are open source tools that can be used for monitoring MySQL clusters. Prometheus can be used to collect metrics from MySQL clusters, and Grafana can be used to visualize the metrics. Starting with Tungsten v7, using the new Tungsten Prometheus Exporter feature, it’s become easy to leverage the best of these powerful monitoring tools.
Part of the reason v7+ makes monitoring simpler is that Prometheus metrics are exported by default. Metrics are available for five (5) different components, providing visibility into every layer of the cluster stack:
- Tungsten Replicator;
- Tungsten Manager;
- Tungsten Connector;
- MySQL Server;
- Node (physical host).
How to Use Prometheus Exporters
Knowing how these monitoring metrics work is important when setting up your own unique monitoring solution.
The Tungsten component metric exporters are considered “Internal Scope” and the MySQL Server and Node metric exporters are “External Scope;” this means that the MySQL Server and physical Node metric exporters require an external binary to function (mysqld_exporter and node_exporter). For your convenience, these two binaries are bundled by Tungsten.
By default, Prometheus metrics are exported on port 9100 via path /metrics, but since there are 5 different sets of metrics, we need 5 different ports to access them all.
| 8091 | Replicator exporter |
| 8092 | Manager exporter |
| 8093 | Connector exporter |
| 9100 | Node exporter |
| 9104 | MySQL exporter |
Command-Line Tools
Command-line tools are an easy way to access the metrics:
-
Curl example:
-
curl -s ‘http://127.0.0.1:{PORT}/metrics’
-
-
tmonitor examples:
-
tmonitor status -
tmonitor test
-
This is the Tungsten tmonitor command in action, giving the status and ports for each component:
tungsten@db1-demo:/home/tungsten # tmonitor status
Tungsten Connector exporter running ok on port 8093
Tungsten Manager exporter running ok on port 8092
MySQL exporter running ok on port 9104
Node exporter running ok on port 9100
Tungsten Replicator exporter running ok on port 8091
All 5 exporters are running ok (Up: Tungsten Connector, Tungsten Manager, MySQL, Node, Tungsten Replicator)
The included Tungsten tmonitor command is a simple tool for the management and testing of Prometheus exporters that is bundled with Tungsten products. You may even use tmonitor with the external exporters; for example, to start, stop, and restart, as well as to install and remove start-at-boot support for the external exporters.
You may view the full help text via tmonitor help, but here are a few additional examples:
-
tmonitor --connector test -
tmonitor --manager –tungsten test -
tmonitor -R -t test -
tmonitor start -
tmonitor --mysql stop -
tmonitor boot -
tmonitor --mysql install -
tmonitor --node remove
Graphical User Interfaces
If you do not want to use command-line tools, you may use a GUI to access the Prometheus metrics. Here are a few examples:
-
Prometheus HTML interface: i.e.
http://{Prometheus Server Hostname Here}:9090/graph -
Grafana HTML interface: i.e.
https://{Grafana Server Hostname Here}:3000/ - Postman.app
Available Metrics - What Can be Seen?
Using tmonitor test, you may view all available metrics.
There are many Tungsten-specific metrics, and these may be viewed using:
-
tmonitor --tungsten test
or,
-
tmonitor [-n | -m | -C | -M | -R] [-t] test
Example metric:
# HELP tungsten_connector_version The Tungsten Clustering software version
number
# TYPE tungsten_connector_version gauge
tungsten_connector_version{version="Tungsten Clustering 7.0.2 build
42",vendor="Continuent",name="Tungsten Connector",} 1.0
Grafana
Grafana is a powerful visualization tool that may be used to look at the metrics. It displays specific Metrics in Panels, and it displays groups of Panels in Dashboards.
Continuent has created a custom, downloadable dashboard for Grafana. In the Grafana GUI, hover over the Dashboards icon in the left navigation bar, then select “Manage” from the sub-menu. Click the “Import” link to the right of the green “New Dashboard” button. In the Grafana.com Dashboard field, enter 12760 for the Continuent Tungsten Dashboard, then click “Load.”
Tungsten Dashboard Integration
If you’re using the Tungsten Dashboard GUI to manage your Tungsten Clusters, you might want to integrate your monitoring solution into that so the monitoring and management of your clusters exist all in one place. We’ve made it easy to access and view your Prometheus/Grafana monitoring implementation inside the Tungsten Dashboard.
Once the Prometheus and Grafana servers are installed, you can enable support in the Tungsten Dashboard Settings panel.

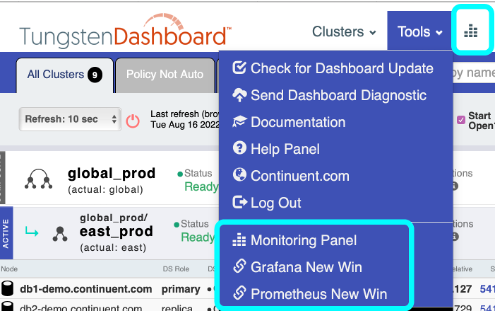
You have a choice as to how you integrate your Prometheus/Grafana into Tungsten Dashboard. You may access Grafana via embedded panels, or you may open a new window for either Prometheus or Grafana web interfaces. Choose your preference in the Tools drop-down as shown here:

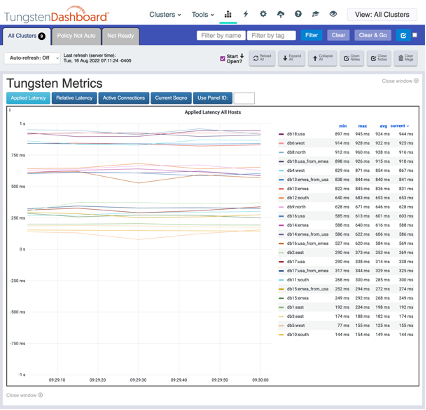
When you open the Monitoring Panel, you will have access to embedded Grafana panels if you have installed Grafana server and the Tungsten Grafana Dashboard for Clustering. There are 4 panels available via buttons, and then you may enter a Grafana Panel ID to access any other panel from the Grafana dashboard. The 4 buttons are:
- Applied Latency;
- Relative Latency;
- Active Connection Counts;
- Current Seqno.

Wrap-Up
Monitoring is essential for any mission-critical application. Every organization has specific monitoring goals, requirements and environments. Continuent Support is here for you to advise, plan, and aid you in setting up and managing the right monitoring solution for you. We hope the work we’ve done to make Prometheus-Grafana integration simpler and better, offers more granular visibility into your cluster operations.
For more information, check out the links below! And contact us if you’re not yet a Continuent customer and would like to discuss your MySQL or MariaDB clustering needs.

Comments
Add new comment