If we could divide our QA into layers, at the bottom layer there are tests of specific features and scenarios. These consist of steps, how to reproduce a certain feature, and how to validate that feature. Individual tests of features and scenarios can be grouped together according to similar characteristics, for example: tests for features/scenarios grouped by topology, tests for TPM, connector tests, API tests…let’s name these groups of tests: “test suites.”
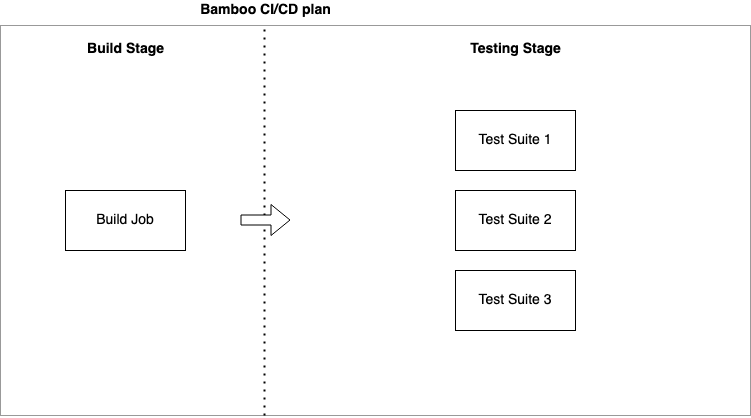
At the very beginning of our CI/CD pipeline, source code and test suites are handed over to our Bamboo server. Bamboo is a continuous integration tool from Atlassian that we use to externally build Tungsten products and run tests on them (and do other automated processes as well). Bamboo is comparable to other CI/CD tools: “Give me instructions, and I will process them.” It's a pretty straight-forward tool, where one ‘Plan’ (CI/CD pipeline process) consists of serial ‘Stages’ (CI/CD steps in pipeline) and each Stage could have any number of parallel ‘Jobs’.
Bamboo was designed to run Plans (CI/CD pipelines) always in the same way:
- “Here are Stages, for source code build and testing”
- “Here are Jobs for running test suites in parallel”
- “Want to skip some Stage or Job? No, dynamic builds are not allowed. Sorry.”
- “You can create more Plans, trigger them when needed and provide artifacts between them.”
In short, we are not using this tool as it was originally designed to be used…
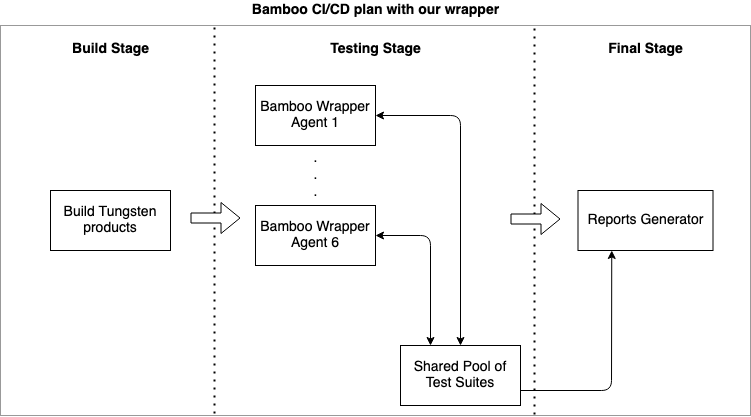
When we are developing, we need some kind of freedom to run test suites, or even specific tests, and provide for custom options in our testing environment. This means we need different levels of testing and different behaviours of the environment. For this reason we developed some intelligent software which is running as a wrapper inside of the Bamboo server. This software nicely changes the behaviour of the Bamboo CI/CD pipeline to fit our needs.

The main characteristics of this tool are:
- Lots of options to customize the environment (Linux distributions, RDBMS versions, Java versions, testing options….).
- Ability to re-run different tests on one product tarball.
- Ability to switch between development branches and versions (Git version control).
- Test suites management.
- Nicely formatted HTML reports generated at the end.
Test Suites Management
So, when testing options are defined, our Bamboo wrapper/tool creates a shared pool of test suites that should be executed, and also defining their corresponding environment. In the next Stage in the sequence, which is actually created from a number of parallel jobs, each running copy of the Bamboo tool ‘takes’ the test suite from a shared pool in an intelligent way:
- The first job, which takes a test with some custom Linux distribution and/or RDBMS version and marks itself as a dedicated job for this environment setup - this saves time in preparing the same environment for multiple parallel jobs.
- Test suites that fit the current job’s setup are taken in order from longest to shortest (according to duration) - this ensures all parallel jobs will have almost the same execution time.

Levels of Testing
Let’s say we don’t need to run all our hundreds of test suites after every application code change. It’s useless and wastes computing power and time (i.e. when developers make a change in Tungsten Connector API v2, but run all available test suites). We call a limited run “branch testing'' (one branch in our Git version control tree represents one new feature, or one fix). For the change made in Tungsten Connector API v2, we need to run only the test suite which tests Tungsten Connector API v2 via branch testing.
In fact, there are options for testing which developers can use wisely to save testing time while ensuring enough testing for coverage of their fix, such as:
- Running only a specific test file (test scenario) - there is no need to run the whole test suite with all test scenarios on the same environment setup.
- Running only one specific test suite - eg. developer wants to run only the test suite for Tungsten Connector API v2.
- Running a ‘family’ of test suites - eg. use an option like ‘TEST-API’ to run all test suites, which is focused on the API v2 (Tungsten Connector, Manager, Replicator, Tungsten Cloud APIs); this way we can also test only a group of test suites focused on, for example, Tungsten Replicator, Tungsten Connector or TPM.
And finally, the true ‘levels’ of testing (used for regular testing of main version control branches, to final release builds):
- Minimal acceptance tests - a group of test suites that cover main functionality, but in wide spectrum. This level takes up to one hour of testing time.
- Running all tests on reference Linux distribution (Amazon Linux 2) and reference MySQL version (MySQL 5.7). As a bonus, there is a fortune wheel combination of Linux distribution and MySQL version which is executed (every build has a different combination, in order, not a random pick). Fortune wheel provides smoke testing, to verify that the other Linux distribution and MySQL version works as expected. Testing can also be fun, huh? This level takes up to 8 hours of testing time.
- Finally, the release level of testing. This level takes almost 24 hours to complete, but it tests all available test suites in all possible combinations of environment setup - using the whole environment matrix, as we described in blog article Part 2: Simulating Realistic Conditions. The output of this testing level is a release candidate - a fully and deeply tested product tarball, which is provided to our customers.
Watching Performance
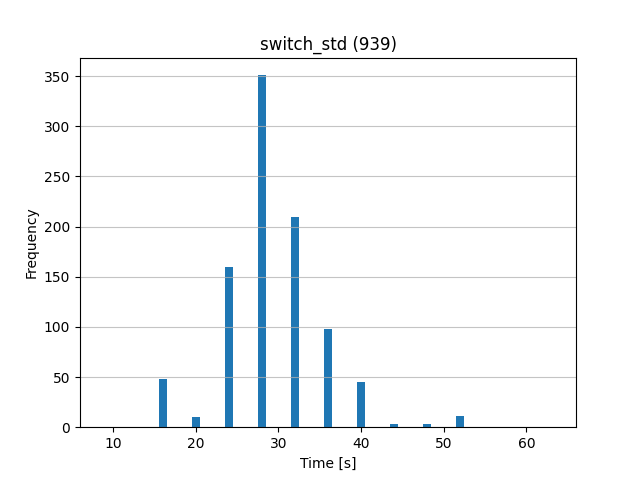
For every cluster operation like switch, failover, recovery, etc., and also some “cctrl” commands and queries through the Connector (aka Proxy), we collect the time to execute such actions. From the collected samples of data, we can generate a nice graph as shown below.

The graph represents (in an ideal case) a normal distribution of data samples, where we can find an average value (major frequency of samples) and a variance of data samples in both directions. From this we can estimate what the standard time should be for the operation (i.e. a cluster switch operation) and what time variance is acceptable.
In reports generated at the end of a testing phase, we can easily watch performance statistics, see a possible regression of an action’s duration or, on the other hand, any improvement.
Conclusion
To view the previous blogs in this QA series, see below, or feel free to reach out to ask any questions:
- Introduction to Business-Critical Software QA: https://www.continuent.com/resources/blog/intro-business-critical-software-qa
- Simulating Realistic Conditions: https://www.continuent.com/resources/blog/qa-for-business-critical-mysql-clustering-simulating-realistic-conditions
- Bug Hunting: https://www.continuent.com/resources/blog/tungsten-bug-hunting-qa-business-critical-mysql-clustering-software

Comments
Add new comment